

Anyhoot, a huge caveat when reading these statistics. They're gathered using Google Analytics, but a lot of people use ad blockers, and some ad blockers will also block Google Analytics. I understand why they do that, but it means that site traffic data is not as reliable as it used to be. Even using it to just identify trends does not necessarily work anymore.
With all that out of the way, how did the Young Writers Society perform in September 2018? Keep on reading to find out!
YWS Stats
Literary Works: 265
Reviews: 1175
Review to Work ratio: 4.43
Forum posts: 592
Storybook posts: 1,889
YWSers also spent a total of 7,898 hours on the site in September 2018!
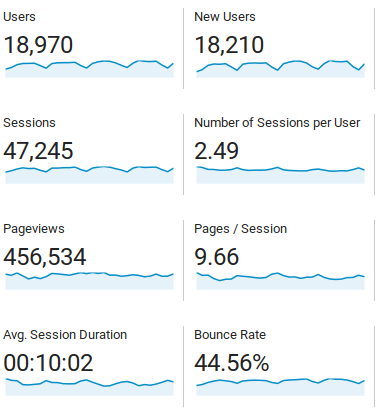
Overall Stats
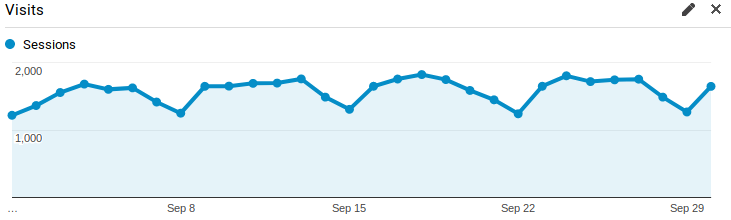
Visits
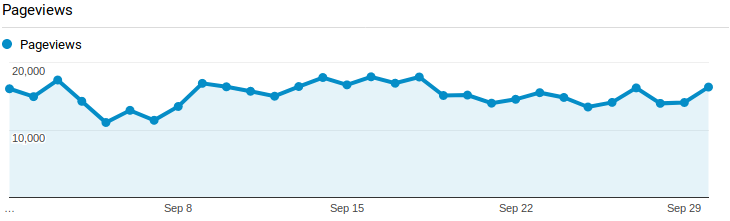
Pageviews
The Browser Wars
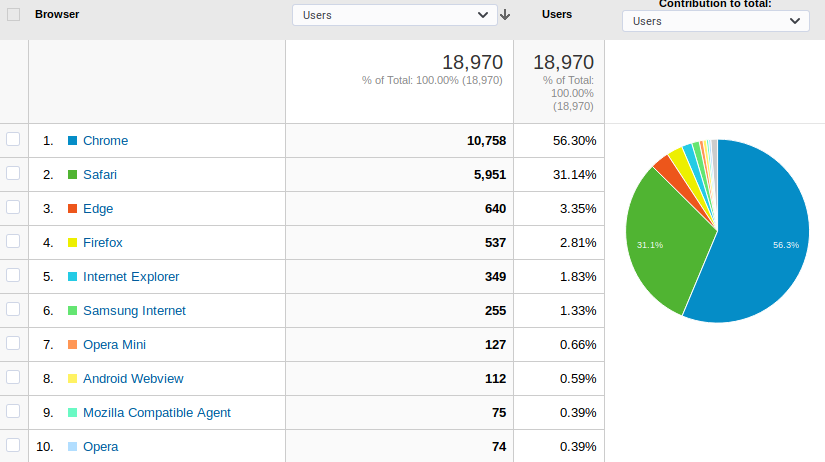
That's Chrome in blue, capturing over half of all visitors! Coming in a distant second is Safari in green (incl. iPhone and iPad Safari). Unfortunately, Edge comes in third with my favorite, Firefox, coming in fourth.
The Map
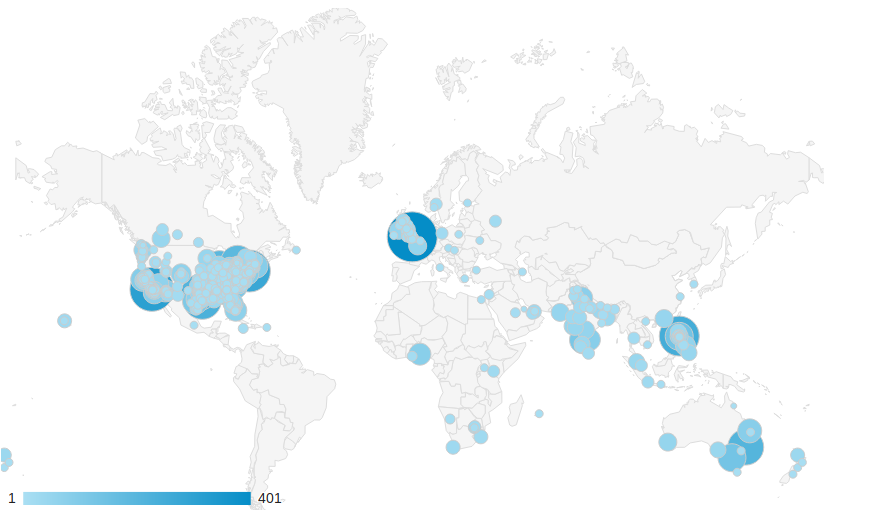
Top 10 Countries
1. United States
2. United Kingdom
3. India
4. Philippines
5. Canada
6. Australia
7. South Africa
8. Pakistan
9. Germany
10. France
Top 10 Cities
1. London
2. Los Angeles
3. New York
4. Quezon City
5. Houston
6. Dallas
7. Sydney
8. Chicago
9. Toronto
10. Atlanta
There's been a lot of changes since I last looked at this. The USA and UK have always been 1 and 2, but usually Canada and Australia took up the next two spots (interchangeably). But now, India and Philippines are bigger than either Canada or Australia. Interesting!
I didn't include the September 2017 data, but the number of pageviews has grown slightly over the last year by 5.24%. The number of visits, though, fell by 3.92%. Between the two, I prefer always going by pageviews since the visits data is too heavily skewed by random Google searches. On the other hand, the number of pageviews actually measures true activity on the site.
On the basis of pageviews, September 2018 was our best September since 2015, when we hit 537,100 pageviews for the month. For 2018 though, it's our second lowest month (the high was in January with 576,302 and the low was in August with 452,374). That's not unusual as September tends to be a quiet month as people transition to the school year.

Gender:
Points: 11417
Reviews: 425